

ESG Report
Waste
We are committed to reducing, reusing and recycling our waste
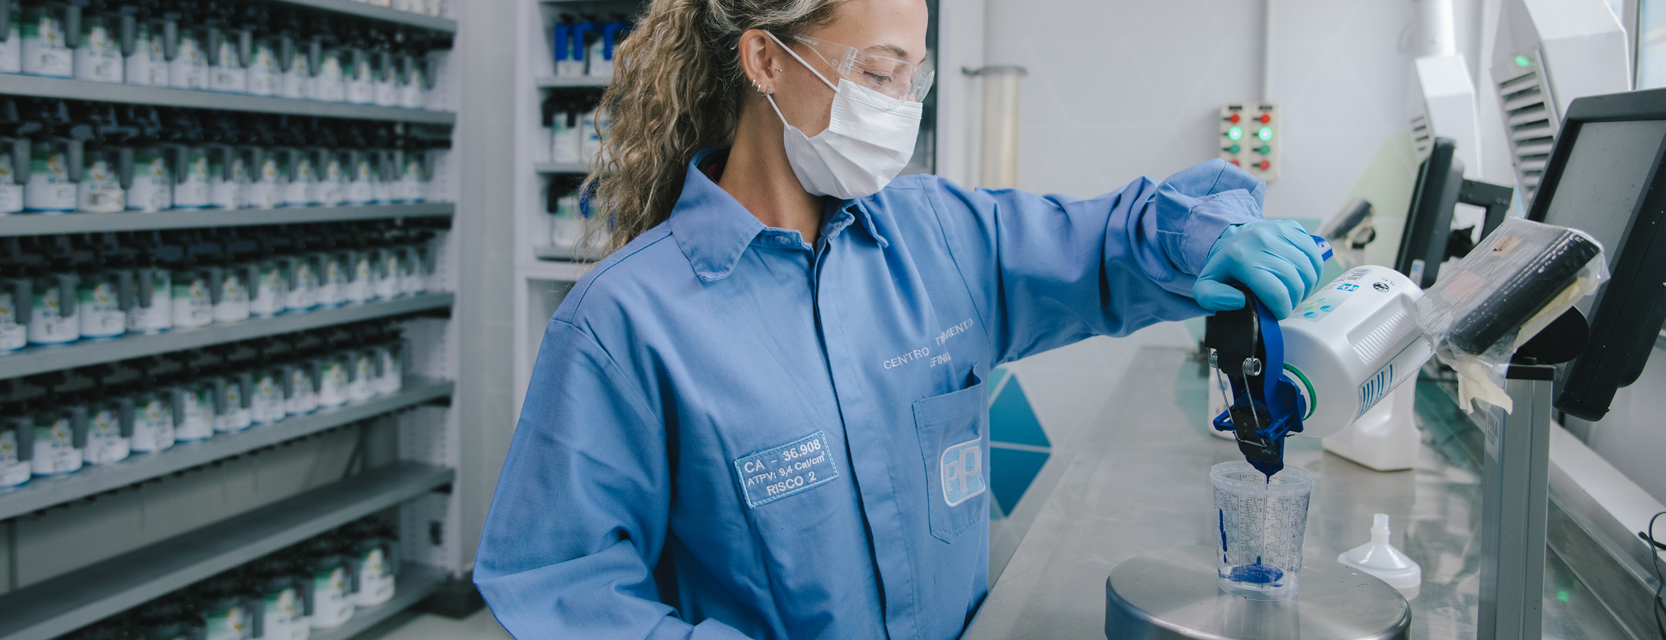
The more efficient we are in using materials to make our products, the less waste we produce, the fewer resources we consume and the more money we save. That is why we first work toward absolute material utilization throughout our manufacturing processes followed by eliminating, minimizing, reusing and recycling the waste materials we do produce.
We acquire raw materials from suppliers and convert them to finished products in our manufacturing process. These products are then transported to customers, where they are applied.
Typical waste streams resulting from these activities include process waste from equipment cleaning, substandard product, by-products and packaging. We evaluate each waste stream for proper management requirements according to internal and legal standards and identify ways to mitigate our impact.
Although we've reached many of our waste disposal and waste-to-landfill goals early, in 2021, we continued to make progress against minimizing our waste. We found new opportunities to reuse residual product that would otherwise be shipped for disposal and updated packaging from virgin to post-consumer recycled (PCR) plastic, ultimately contributing to the circular economy. Our architectural coatings products packaging, excluding the handle and lid, have up to 100% recycled content in the U.S. and up to 80% in Europe. We are currently testing packaging that uses 100% recycled content for the lid. We also expanded our partnerships with organizations focused on circularity and waste reduction, including PAINTBACK® in Australia, an initiative designed to divert unwanted paint and packaging from ending up in landfill and vital waterways.
Waste Stewardship
We employ waste mapping to track waste streams back to their sources in our facilities worldwide. Using lean manufacturing methodologies, each facility eliminates or minimizes the identified wastes one source at a time, typically starting with the highestvolume or highest-cost waste stream identified through the mapping process. We explore reuse and recycling options for wastes that remain.
Our Resource Management Subcommittee of our Sustainability Committee is helping us move beyond manufacturing to other areas in the company, such as product formulation and raw materials management, where waste can be eliminated or minimized.
We are measuring our performance against two goals:
A 25% reduction in total waste disposal intensity by 2025 from a 2017 baseline.
Achieve zero landfill status from process waste at 35% of PPG's manufacturing and research and development (R&D) locations by 2025.
We achieved the intensity goal in 2019 but remain focused on waste reduction to ensure continuous improvement. Our 2021 total waste disposal intensity was 2.2 metric tons of waste produced per 100 metric tons of production, which was a 37.5% decline from the 2017 baseline. Reduced production during the pandemic was a significant factor behind this performance.
Globally, we disposed of 84,970 metric tons of waste in 2021, which was a 42.2% reduction from 2017. Of our manufacturing and R&D locations, 40% sent zero process waste to landfill.
In 2021, our regional waste coordinators worked with their top waste-producing sites to develop and implement location-specific waste minimization plans. We also continued cultivating a culture of waste minimization throughout the entire organization using a lifecycle approach and sharing best practices from our top-performing sites with all locations.
Scraping the bottom of the barrel to reduce waste
We look for opportunities to reduce waste wherever we can, including with residual product from customers. In our Automotive OEM adhesives and sealants facility in Adrian, Michigan, reusable product containers returned from customers typically contain approximately 20 gallons of quality material remaining at the bottom of the container. Previously, that material was disposed of as waste. Now, the Adrian facility reclaims this product and stores it for future use. Through close coordination with the Technical and Quality Control (QC) departments, if the reclaimed material is deemed usable, the Adrian operations team reworks the material into future product batches.
In 2021, over 2.4 million pounds of material was reclaimed as a result of this initiative, generating a cost avoidance of approximately 87 waste loads that didn’t go to a landfill.
We manage waste disposal using a global waste stewardship process that covers all waste contractors that provide waste treatment, storage, disposal or recycling services. These contractors must undergo an auditing process and satisfy purchasing terms and conditions before being approved for use. Compliance with this program reduces our worldwide waste footprint, assures proper waste disposal practices and supports our overall sustainability targets.
Each of our locations is responsible for collecting its waste data. Waste that is shipped off-site for disposal is reported into a central data system, allowing us to monitor performance, identify areas for improvement, and capture and share best practices.
Post-consumer recycled plastic for a better environment
Our Søborg, Denmark, Architectural Coatings plant recently updated all product packaging from virgin plastic to post-consumer recycled plastic (PCR). In the past, all product was packaged in virgin plastic. Changing to 90% PCR plastic not only helped us lower our carbon footprint but also resulted in lower packaging costs and production time due to greater efficiencies from alignment in packaging sizes. In total, the project is anticipated to save more than 308 metric tons of carbon annually once fully complemented in mid-2022.
Reducing paint waste and promoting circularity
Our commitment to reducing waste goes beyond our operations to the end user. For example, we participate in the PAINTCARE™ program in the U.S., which allows consumers to recycle leftover or unwanted paint.
Ten states, as well as the District of Columbia, have adopted the PaintCare program, and PPG has 49 stores that act as recycling drop off sites. Since the program's inception in 2009, PaintCare has collected more than 54 million gallons of paint and hosted more than 275 paint drop off events.
We also collaborate with the ECO-PEINTURE™ non-profit in Quebec, Canada. Through this program, approximately 7 million kilograms of paint per year are diverted away from landfills. Since 2001, over 100 million kilograms of paint and empty containers have been recycled through the program. Throughout eight other provinces in Canada, we partner with ProductCare, which provides recycling locations for various types of leftover paint, as well as free leftover paint to the public through its PaintShare program. ProductCare estimates that 10.3 million liters of paint were recovered in 2020 – nearly enough to paint the Trans Canada Highway twice.
Lastly, PPG is a founding member of Paintback in Australia, an initiative designed to divert unwanted paint and packaging from ending up in landfill and vital waterways. Along with responsibly disposing of unwanted paint, Paintback is committed to researching new ways to repurpose unwanted paint materials and help develop a circular economy. Last year, over 9 million tons of paint and packaging waste was diverted from landfills thanks to this program. The organization's target is to divert 90% of waste paint from landfill.
We are exploring additional paint recycling opportunities with trade associations globally where available.
Sumaré facility reduces water waste by 36 tons per year
While our Sumaré facility earned a Green Stamp (Selo Verde) by the sustainability committee of Jornal do Comércio, the plant is not one to rest on its laurels. The plant continues to strive toward a more sustainable future by improving its operations each day, including recently announcing plans to water nearby landscapes and gardens with water discharged during testing for their fire pumps, and reduce water use by implementing a high-pressure wash system for process tanks. This work is projected to reduce their waste by approximately 36 tons per year.
Total Waste Disposal |
||
|---|---|---|
|
|
Intensity |
Disposed |
|
2017 |
3.52 |
147.10 |
|
2018 |
3.34 |
140.98 |
|
2019 |
2.69 |
106.97 |
|
2020 |
2.33 |
85.77 |
|
2021 |
2.20 |
84.97 |
Total waste disposed includes landfilled, incinerated and treated waste. Excludes waste associated with a 2017 furnace rebuild at our Lake Charles, Louisiana, plant. Data changes from prior reporting reflect adjustments for acquired and divested locations from the 2017 baseline onward.
Solid WasteThousand metric tons |
|||
|---|---|---|---|
|
|
Generated |
Recycled |
Disposed |
|
2017 |
229.84 |
82.73 |
147.10 |
|
2018 |
220.38 |
79.40 |
140.98 |
|
2019 |
179.82 |
72.85 |
106.97 |
|
2020 |
150.58 |
64.81 |
85.77 |
|
2021 |
157.25 |
72.28 |
84.97 |
Disposed waste does not include waste that is recycled, reclaimed or incinerated for energy recovery. Data changes from prior reporting reflect adjustments for acquired and divested locations from the 2017 baseline onward.
Waste Generated/Recycled |
||||||
|---|---|---|---|---|---|---|
| Non-hazardous Waste | Hazardous Waste | |||||
| Generated (thousand metric tons) |
Recycled (percent) |
Disposed (thousand metric tons) |
Generated (thousand metric tons) |
Recycled (percent) |
Disposed (thousand metric tons) |
|
|
2017 |
115.78 |
22% |
90.17 |
114.06 |
50% |
56.93 |
|
2018 |
107.89 |
23% |
82.91 |
112.49 |
48% |
58.08 |
|
2019 |
73.96 |
33% |
49.92 |
105.86 |
46% |
57.06 |
|
2020 |
62.38 |
34% |
41.39 |
88.21 |
50% |
44.38 |
|
2021 |
67.94 |
36% |
43.46 |
89.31 |
54% |
41.51 |
Data for hazardous waste recycled include waste that was used to generate energy through direct incineration. We report our hazardous waste data using the regulatory framework of each country where we operate. Data changes from prior reporting reflect adjustments for acquired and divested locations from the 2017 baseline onward.
Remediation
Some of our past waste-disposal methods, which were authorized and accepted industry practices in their time, can require environmental remediation or land reclamation to meet today's regulations, our stringent internal standards or stakeholder expectations.
We use a lifecycle approach to assess and manage environmental issues and impacts at all of our facilities. A site assessment, which we require at various stages in a facility's lifecycle, provides an environmental evaluation according to standard industry practices.
The assessment determines what, if any, remediation activities or restrictions will be implemented to meet our ultimate goal— each facility is in a condition in which it can be reused safely and productively.
To learn more about our remediation efforts in Jersey City, please refer to our 2021 Form 10-K, beginning on page 64.
Supporting conservation efforts and biodiversity at Barberton
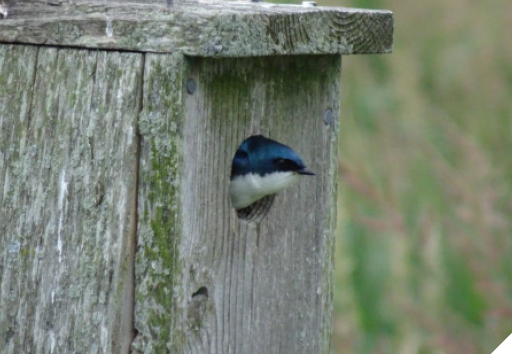 In 2021, our remediation project of the Lime Lakes in Barberton, Ohio, was awarded a Silver certification from the Wildlife Habitat Council Conservation, an improvement from previous years' original "certified" status. The Lime Lakes have been continuously certified under this organization as a wildlife habitat since 1995.
In addition to recognition from the Wildlife Habitat Council Conservation, this site has also been listed as an official "hot spot" by eBird, a project of the Cornell Lab of Ornithology, for its spectacular birding potential. Furthermore, the Greater Akron Audubon Society completes their annual breeding bird survey on PPG's Lime Lakes. We plan to continue improving upon this site and others like it as we further our conservation and biodiversity efforts.
"As farms have gotten gobbled up by progress within Summit County, large undisturbed prairie-like settings are few and far between. Places like the PPG Lime Lakes offer a phenomenal reclaimed habitat lacking within the county... the reclaimed PPG Lime Lakes have been a mainstay over the years as well as a blueprint of how just setting aside some crucial habitat is beneficial to more than just birds, but other flora and fauna, and people as well."
Douglas W. Vogus
Census Coordinator,
Greater Akron Audubon Society
Spills and Releases
Our facilities have strong management practices in place to prevent spills and releases.
Our corporate spill elimination standard requires the establishment, and annual self-assessment, of a spill elimination program at each facility. The program consists of the following steps:
- Assessment of a facility's spill elimination performance;
- Improvement plans based on prioritized assessment of risk;
- Corrective action plan with defined dates; and
- Completion of planned action.
An effective tool used by our locations is spill elimination workshops. During these events, employees from various functions use a rapid improvement process and checklist to assess their facilities to identify areas for immediate improvement, as well as opportunities for longer term action planning. While the pandemic prevented us from holding in-person workshops beginning in 2020 and through 2021, we did conduct virtual assessments and began to reinstate in-person workshops at the end of last year. We plan to fully return to the workshop format once it is safe to do so.
Our thresholds for reporting a spill are stringent, allowing us to identify issues before they become significant. These thresholds vary by material and government-reportable levels, with the lowest threshold at 11 pounds (5 kilograms). Our internal reporting requirements also include spills that are fully captured by secondary containment and recovered with no environmental impact. Risks associated with spills and releases having off-site environmental impact include clean-up costs, future liabilities and reputational risks.
Our median spill in 2021 was 26.0 pounds (12 kilograms), with 99.4% of spills contained onsite. We had two significant spills during the year that totaled 4,843 gallons (18,333 liters). One of these spills was confined to secondary containment, and the second was contained onsite.
Our goal is at least a 65% improvement in our spills and releases rate by 2025 from a 2017 baseline. Our 2021 rate of 1.28 spills and releases per 1,000 employees was 30.4% lower than the baseline.
We continue to implement ways to improve operations to reduce and eliminate the risk of spills. We focused on sites of higher risk by:
- Requiring overflow protection for stationary process and storage vessels;
- Clearly labeling all lines and connections with contents/destination;
- Securing portable tanks and loose containers on pallets when transported around the facility; and
- Conducting environmental and spill control training at all facilities on an ongoing basis.
Coupled with these efforts, an overfill protection program alerts our operators or delivery person when a given product is reaching a certain level in a vessel. Having an alarm or method of visual observation provides enough time to shut off product flow to avoid a potential release.
Spills and Releases RateTotal spills and releases per 1,000 employees |
|||
|---|---|---|---|
|
2017 |
1.84 |
||
|
2018 |
1.32 |
||
|
2019 |
1.25 |
||
|
2020 |
1.24 |
||
|
2021 |
1.28 |
||