

ESG Report
Energy

We are creating a culture of energy innovation and conservation
PPG is committed to fulfilling our purpose to Protect and Beautify the World. As part of this, we are focused on reducing the environmental impact of our operations in part by reducing our energy consumption to minimize our greenhouse gas (GHG) emissions, reducing costs, increasing renewable energy sourcing and maximizing resource efficiencies.
We will do this by:
- Reducing our annual consumption through implementation of innovative energy solutions.
- Ensuring reliable supply of energy and contingency measures in the event of a power failure or gaps in renewable energy generation.
- Renewable energy sourcing through direct investment, power purchase agreements, renewable energy certificates and green tariffs.
- Asset electrification through conversion of technologies that use fossil fuels (coal, oil and natural gas) with technologies that use electricity to control electricity generation resourcing.
2021 Highlights
In 2021, we continued to find new opportunities to expand our use of renewable energy and install new energy saving technologies, such as launching a partnership with Constellation, a leading energy solutions provider. We began conducting full-scale energy audits at our largest consuming facilities with the U.S. market and as a result implemented energy efficient LED lighting at several facilities, with an additional dozen facilities currently under analysis of further efficiencies.
We also implemented new energy management requirements, based on ISO 50001 and Energy Star, at select priority sites for evaluation and feedback.
The Natural Resources and Climate Change Subcommittee of our Sustainability Committee oversees our energy-reduction strategy and actions, which are focused on developing an energy-conscious culture through communication and awareness building; developing the aforementioned energy management requirements; identifying and focusing resources on locations with the highest energy use; and increasing the use of renewable energy in our operations, which will be critical to supporting our reduction targets for our Scope 1 and 2 emissions.
Key requirements include:
- Identification and characterization of energy usage;
- Identification and documentation of all regulatory requirements for energy usage;
- Compliance with all regulatory requirements;
- Documented operational practices to reduce energy consumption, including identification of equipment with high energy use, a written preventative maintenance program and energy-reduction practices;
- Training on energy use and minimization; and
- Documentation and records pertaining to energy usage.
These efforts are supported by an internal portal for sharing energy management training documentation, tools, resources and best practices. In addition, our tracking system helps gauge performance on a timely basis. We plan to roll out the updated requirements to all locations in 2022.
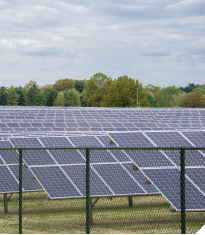
Switching to solar in Carrollton
PPG is working with Constellation, a leading competitive energy and energy solutions provider, to purchase renewable energy from the 200 MW Big Star Solar Project currently under development in Bastrop County, Texas.
Through a 10-year agreement, PPG will receive energy and project-specific renewable energy certificates (RECs) from Big Star. PPG will procure approximately 4.6 million kilowatt hours of energy per year from the company, avoiding more than 3,200 metric tons of carbon emissions annually, the equivalent of taking more than 700 cars off the road, according to US EPA estimates. PPG intends to expand renewable energy at other PPG locations across the U.S.
We are continuing to explore how to increase our use of offsite renewable energy offerings within the U.S. and Europe in 2022.
Reducing energy use more than 40% in Toronto by switching to LED lighting
Our Toronto facility upgraded to more energy efficient LED lighting in all areas of the building that operate 24 hours a day. This included 540 high bay fixtures in the warehouse as well as an additional 107 fixtures in stairways, hallways, lunchroom, shipping offices and locker rooms. As a result of the LED replacements, the annual total energy consumption has decreased 41%, resulting in annual savings of 38% in energy costs.
Generating cleaner energy in Caivano
Last year, PPG's facility in Caivano, Italy, installed a Combined Heat & Power (CHP) unit. CHP is a cleaner approach to generating electrical power and useful thermal energy from natural gas leading to improved sustainability and commercial competitiveness. The unit captures the waste heat that is created when generating electricity to produce steam and hot water for the site. These efforts create an efficiency improvement equating to an annual reduction of approximately 1,100 MT of CO2 (or 7,200 MT over the project life).
Because the vast majority of our coatings are produced at ambient temperatures and pressures, the production processes are not energy intensive. The milling step is the most energy intensive, and we are focused on making this step more energy efficient. We are also shortening cycle times and making other changes to reduce the energy required to manufacture our resins, which we typically produce in reactors that may require heating or cooling.
Energy Data
We consumed 12.4 million gigajoules of energy in 2021, which was a 16.9% increase from 2020. Our energy intensity was 3.20 gigajoules per metric ton of production – an 11.4% increase over the prior year. Our direct energy intensity increased 2.5%, and our indirect energy intensity decreased 4.7% since 2017. Like many companies, we experienced sizeable pandemic-related impacts in 2020 that resulted in production operation disruptions across the world at many of our facilities. The change in production mix as well as supply chain interruptions resulted in an unusual energy intensity result for 2020. As operations recovered in 2021, our energy intensity returned to a more traditional level, although our absolute energy reduction in 2021 totaled 8% from 2017. In addition to supply chain abnormalities, many of our associates were working from home, a transition that impacted energy use at our offices.
In 2021, 6.3% of our total energy consumed came from renewable sources. We achieved a significant improvement in our renewable energy use by reaching 23.9% renewable electricity in 2021, nearly to our 25% by 2025 goal. This result demonstrates our continued commitment to identifying renewable energy sources and securing agreements that support our overall decarbonization commitments.
Energy IntensityGigajoules per metric ton of production |
|||
|---|---|---|---|
| Total | Direct | Indirect | |
|
2017 |
3.21 |
1.89 |
1.32 |
|
2018 |
3.23 |
1.93 |
1.30 |
|
2019 |
3.23 |
1.90 |
1.33 |
|
2020 |
2.87 |
1.66 |
1.21 |
|
2021 |
3.20 |
1.94 |
1.26 |
Energy intensity includes all types of energy consumed within the organization related to manufacturing and research and development. Data changes from prior reporting reflect updated data and adjustments for acquired, divested and closed locations from the 2017 baseline onward.
Energy ConsumptionMillion gigajoules |
|||
|---|---|---|---|
| Total | Direct | Indirect | |
|
2017 |
13.48 |
7.93 |
5.55 |
|
2018 |
13.65 |
8.16 |
5.50 |
|
2019 |
12.89 |
7.60 |
5.30 |
|
2020 |
10.56 |
6.10 |
4.46 |
|
2021 |
12.35 |
7.48 |
4.87 |
Direct energy consumption is the amount of primary energy we combust on-site. Our direct energy sources may include coal, natural gas, fuel distilled from crude oil, propane, biofuels, ethanol and hydrogen. Indirect energy refers to the energy we consume that is generated by external suppliers. We consume indirect energy through electricity, heat, steam and electricity generated from renewable energy sources, such as solar and wind. Data changes from prior reporting reflect updated data and adjustments for acquired, divested and closed locations from the 2017 baseline onward.
Energy Consumption by SourceMillion gigajoules/percent of total energy consumption |
||||||||||
|---|---|---|---|---|---|---|---|---|---|---|
| Source | 2017 | 2018 | 2019 | 2020 | 2021 | |||||
|
|
Million Gigajoules |
Percent |
Million Gigajoules |
Percent |
Million Gigajoules |
Percent |
Million Gigajoules |
Percent |
Million Gigajoules |
Percent |
|
Nonrenewable fuels purchased and consumed |
7.93 |
58.85 |
8.16 |
59.75 |
7.60 |
58.91 |
6.10 |
57.74 |
7.48 |
60.57 |
|
Nonrenewable electricity purchased |
2.97 |
22.07 |
2.92 |
21.42 |
2.75 |
21.29 |
2.49 |
23.61 |
2.48 |
20.10 |
|
Steam/heating/cooling and other nonrenewable energy purchased |
1.96 |
14.55 |
1.92 |
14.06 |
1.91 |
14.79 |
1.34 |
12.73 |
1.65 |
13.04 |
|
Total renewable energy purchased or generated |
0.61 |
4.53 |
0.65 |
4.77 |
0.65 |
5.01 |
0.63 |
5.92 |
0.78 |
6.30 |
|
Total nonrenewable energy sold |
0.00 |
0.00 |
0.00 |
0.00 |
0.00 |
0.00 |
0.00 |
0.00 |
0.00 |
0.00 |
|
Total nonrenewable energy consumption |
12.86 |
95.47 |
13.00 |
95.23 |
12.25 |
94.99 |
9.94 |
94.08 |
11.57 |
93.07 |
Data changes from prior reporting reflect updated data and adjustments for acquired, divested and closed locations from the 2017 baseline onward.
Energy CostsMillions of dollars |
|||
|---|---|---|---|
|
2017 |
141.68 |
||
|
2018 |
155.71 |
||
|
2019 |
135.79 |
||
|
2020 |
113.72 |
||
|
2020 |
165.25 |
||
Data changes from prior reporting reflect updated data and adjustments for acquired, divested and closed locations from the 2017 baseline onward.