

ESG Report
Emissions
We are focused on reducing greenhouse gas emissions across our operations and value chain
Climate change is one of the greatest challenges of our time, and we are committed to doing our part to help protect the planet.
Our goal is to reduce our greenhouse gas (GHG) emissions intensity by 15% measured in total tons discharged by 2025 from a 2017 baseline. We reduce air emissions globally through improved operating practices, product reformulations and, where necessary, emissions control equipment. The composition of our emissions varies by facility due to the different products produced and manufacturing processes used. Collectively, these goals and the operating changes we are making to meet them are two of the ways that we are contributing to the U.N. Sustainable Development Goals (SDGs) SDG7 (Clean Energy) and SDG13 (Climate Action).
In 2021, we achieved a 9.7% reduction in intensity and a 16.1% reduction in absolute direct (Scope 1) and indirect (Scope 2) GHGs from the baseline. Our global GHG emissions increased slightly in 2021 versus 2020, primarily in response to more normal levels of production across our facilities and product lines as compared to the first year of the pandemic. However, we continue to seek new opportunities to reduce our GHG emissions in line with our targets and goals.
Our approach to reducing greenhouse gas (GHG) emissions includes lowering our energy consumption (see the Energy section). As such, we are replacing outdated and inefficient equipment, such as boilers, chillers and air compressors. We are undertaking these replacements over time to optimize the impact, focusing on priority sites based on improvement opportunities and resources required to achieve those reductions.
Beyond improved environmental outcomes and performance, these efforts will also reduce our operations costs. The potential financial benefits from reducing our emissions can already be realized at our site in Tianjin, China.
In addition to lowering energy consumption by implementing innovative energy solutions, we are exploring options to:
- Ensure reliable supply of energy and contingency measures in the event of a power failure or gaps in renewable energy generation.
- Source renewable energy through direct investment, power purchase agreements, renewable energy certificates and green tariffs.
- Create asset electrification through conversion of technologies that use fossil fuels (coal, oil and natural gas) with technologies that use electricity to control electricity generation resourcing.
For example, in 2021, our Architectural Coatings plant in Carrollton, Texas, entered an agreement to power the facility through 100% renewable solar power, avoiding more than 3,200 metric tons of carbon emissions annually.
Tianjin environmental performance will save PPG millions
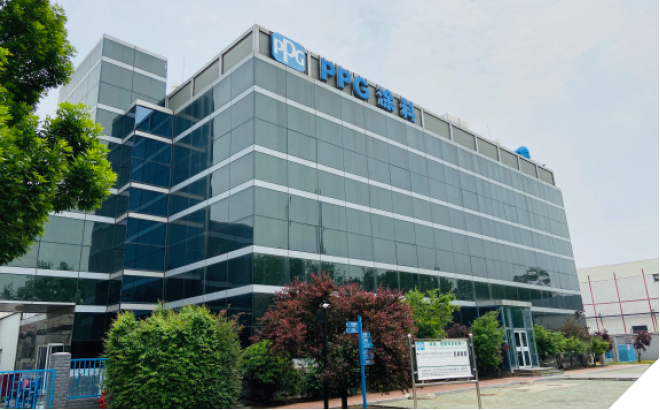 Of the thousands of companies with operations in Tianjin, only 18 companies are considered "Class A Enterprises." PPG is one of them. Thanks to the facility's environmental control policy, the Tianjin City Ecology and Environment Bureau has determined PPG's Tianjin facility can operate normally during periods of heavy air pollution. This designation allows PPG to continue producing products to meet customer delivery expectations and avoids unnecessary shutdown costs.
"The Class A Enterprise designation is not the result of a one-time achievement, it is the result of continuous EHS improvement and years of our 'Raise-The-Bar' strategy."
Michael Fu
Tianjin plant manager
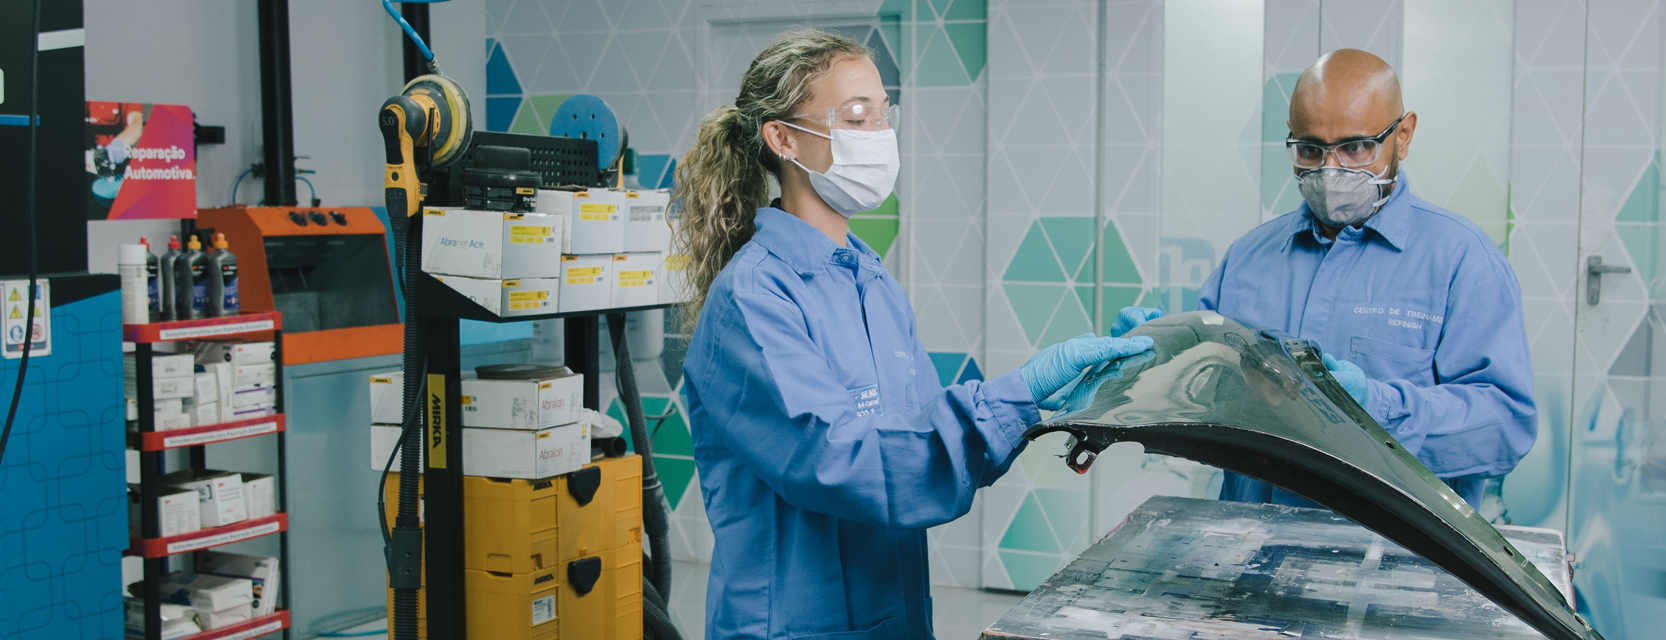
Sumaré awarded 'Green Stamp' for sustainability
 Our coatings manufacturing plant in Sumaré, Brazil, was awarded the Green Stamp (Selo Verde) by the sustainability committee of Jornal do Comércio, a Portuguese newspaper in Rio de Janiero, in recognition of the facility's commitment to the environment.
The stamp is awarded to a select group of companies that are conscientious in the areas of water and effluents, energy, raw materials and waste, atmospheric emissions and environmental education. This recognition is the result of the PPG Sumaré team's steadfast commitment to increasing its use of renewable energy, reducing waste generation and optimizing its manufacturing processes.
In 2021, we experienced increases in all other key emissions sources, also due to a return to more normal levels of production across our business. While we do not report hazardous air pollutants (HAPs) on a global level, we do track those emissions at our U.S. facilities. In 2021, our U.S. operations emitted 165.4 metric tons of HAPs.
Lloyd's Register Quality Assurance provided limited assurance on our Scope 1 and Scope 2 GHG data. View the assurance report.
Greenhouse Gas Emissions IntensityMetric tons of emissions per metric ton of production |
|||
|---|---|---|---|
|
Total |
Direct |
Indirect |
|
|
2017 |
0.24 |
0.09 |
0.15 |
|
2018 |
0.23 |
0.10 |
0.14 |
|
2019 |
0.23 |
0.10 |
0.13 |
|
2020 |
0.21 |
0.08 |
0.12 |
|
2021 |
0.22 |
0.10 |
0.12 |
Total intensity data include direct and indirect emissions. We report greenhouse gas as carbon dioxide equivalents for carbon dioxide, methane and nitrous oxide. Data changes from prior reporting reflect updated data and adjustments for acquired and divested locations from the 2017 baseline onward. Total may not equal the sum of direct and indirect due to rounding.
Greenhouse Gas EmissionsMillion metric tons of carbon dioxide equivalents |
|||
|---|---|---|---|
|
Total |
Direct |
Indirect |
|
|
2017 |
1.00 |
0.39 |
0.61 |
|
2018 |
0.99 |
0.41 |
0.58 |
|
2019 |
0.92 |
0.38 |
0.54 |
|
2020 |
0.77 |
0.31 |
0.46 |
|
2021 |
0.84 |
0.39 |
0.45 |
Our plants are not significantly impacted by emission-limiting and/or emissions reporting-based programs or regulations. In 2021, we had zero direct emissions that were covered under an emissions-limiting regulation or program.
Air Emissions IntensityMetric tons of emissions per 1,000 metric tons of production |
||||
|---|---|---|---|---|
|
Particulates |
Volatile Organic Compounds |
Nitrogen Oxides |
Sulfur Dioxide |
|
|
2017 |
0.10 |
0.51 |
0.28 |
0.02 |
|
2018 |
0.10 |
0.53 |
0.27 |
0.02 |
|
2019 |
0.10 |
0.63 |
0.24 |
0.02 |
|
2020 |
0.08 |
0.50 |
0.17 |
0.02 |
|
2021 |
0.10 |
0.49 |
0.27 |
0.01 |
Data changes from prior reporting reflect updated data and adjustments for acquired and divested locations from the 2017 baseline onward.
Air EmissionsMetric tons |
||||
|---|---|---|---|---|
|
Particulates |
Volatile Organic Compounds |
Nitrogen Oxides |
Sulfur Dioxide |
|
|
2017 |
412.67 |
2,126.21 |
1,158.74 |
86.11 |
|
2018 |
427.57 |
2,247.74 |
1,153.96 |
93.97 |
|
2019 |
383.12 |
2,527.91 |
937.24 |
86.26 |
|
2020 |
311.62 |
1,840.88 |
616.58 |
73.59 |
|
2021 |
374.47 |
1,876.77 |
1,048.88 |
42.20 |
Data changes from prior reporting reflect updated data and adjustments for acquired and divested locations from the 2017 baseline onward.